


The Uptrend
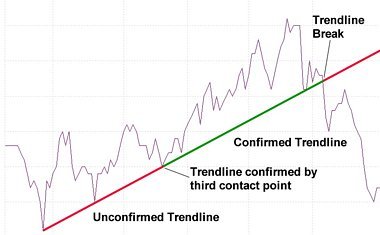
An uptrend occurs when stock prices trace higher highs and higher lows. We can add a rising trendline to a chart by linking the low points. This is shown in the chart below.
Some trends continue for many months or years, others for days or weeks. We need an objective measure of the point at which a trend begins and ends.
As soon as we have two consecutive lows on a price chart we can join them to make an unconfirmed trendline.
For a trendline to be confirmed, and hence validated, the share price must respect it by rebounding from it a third time.
A buy signal is generated when the trendline is confirmed / validated.
Provided the share price stays above the trendline, we hold on to the stock.
We continue to hold until a sell signal is generated by a trendline break.
We then stay out of this stock until either a trendline break signals the end of the downtrend or, more conservatively, until a new uptrend is confirmed.
By investingator.com
http://www.investingator.com/uptrend.html


